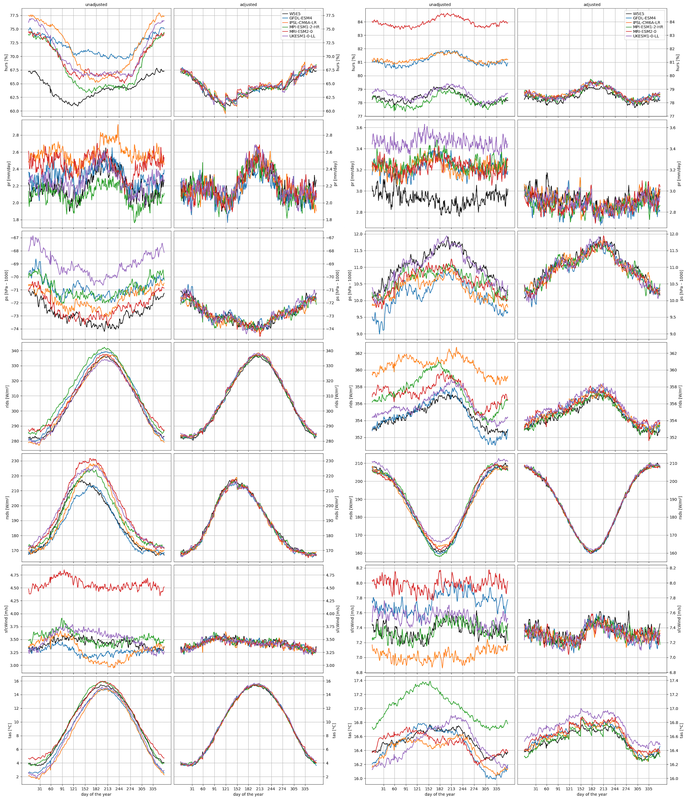
Statistics of ISIMIP3b bias-adjusted climate input data were found to be discontinuous at each turn of the month. The reason for this is that the ISIMIP3 bias adjustment was applied calendar month by calendar month.
In short, all values belonging to a particular month were pooled and then quantile-mapped such that the distribution of those pooled values became more similar to the observed distribution. Where simulated and observed annual cycles differ in shape, this approach produced discontinuous annual cycles.
The discontinuities potentially occur at every turn of the month for all climate variables and statistics. As an example, we here show 2001-2010 multi-year daily mean values of several climate variables averaged over all land (left-side figure; download high-quality version) or ocean (right-side figure; download high-quality version) grid cells, with results before and after bias adjustment shown in the left and right column, respectively.

