Tools that use ISIMIP data to explore past and future climate impacts.
Note: the listed tools are developed and maintained by independent third parties and we do not take any responsibility for their quality and correctness.
Tools that use ISIMIP data to explore past and future climate impacts.
Note: the listed tools are developed and maintained by independent third parties and we do not take any responsibility for their quality and correctness.
Climate Impact Explorer (Climate Analytics gGmbH; cross-sectoral)
The tool shows how the severity of climate change impacts will increase over time in continents, countries and provinces at different levels of warming, starting with 1.5°C, the limit in the Paris Agreement. It also allows access to the underlying data.

SENSES Extreme Events Module (cross-sectoral)
Investigate how exposure to crop failures, river floods, tropical cyclones, heatwaves, wildfires, and droughts changes with rising temperature levels.
The tool is part of the SENSES Toolkit which contains different modules to help understand and communicate climate change scenarios

SENSES Earth Module (cross-sectoral)
Use this tool to explore how the world could be affected by climate extreme events at different global warming levels.
The module is part of the SENSES Toolkit which contains different modules to help understand and communicate climate change scenarios.

ISIpedia: the open climate-impacts encyclopedia (cross-sectoral)
ISIpedia is an online portal for national-level, cross-sectoral climate-impact assessments, based on state-of-the-art climate-impacts simulations from ISIMIP. Key features of ISIpedia include:

My Climate Future (cross-sectoral)
This tool calculates how many more climate extremes you will face across your lifetime relative to a world without climate change, and considering how old you are, where you live, and according to three different warming scenarios. The tool is based on ISIMIP2b data and a corresponding peer reviewed study.

GGCMI crop yields viewer (Climate change factor yield response map)
The viewers show long-term average crop yield changes for maize, wheat, rice, and soybean in response to systematic local changes in temperature, precipitation, CO2 concentration and fertilizer application as simulated by the GGCMI project (AgMIP Global Gridded Crop Model Intercomparison Project).
Here, an ensemble of 6 crop models is used to represent core climate factor responses that are considered robust by the crop modeling community. You can use the viewer’s interactive sliders to visualize responses to isolated and combined changes in temperature, precipitation (rainfall), carbon dioxide concentration and fertilizer application.

CAVA: Climate and agriculture risk visualization and assessment (FAO; free login required)
Use this tools to explore yield anomalies for 8 crops according to different scenarios (SSP126, SSP370, SSP585) and derived from different global gridded crop models. You can visualize spatial data as cartographic layers, create tailored time series, or reports and may even download raw data (in small chunks) and export visualizations.

Climate Change Impact on Water Resources - Explorer (CCIWR)
This app explores potential future changes in global water resources using a multi-model ensemble from the ISIMIP3b protocol. It is designed to support local and regional participatory processes for identifying strategies to adapt to climate change in the water sector. By showing the range of potential future changes in water resources resulting from uncertain future emissions and the limitations of climate and hydrological models, it enables stakeholders to decide which future changes they wish to adapt to, depending on their level of risk aversion.
Maps present the median relative change of a variable (total runoff, groundwater recharge, actual evapotranspiration), and reflect model agreement on simulating a specific change in that variable. Additionally, ensemble distribution shifts at a selected location across three future periods (2016-2045, 2041-2070, 2071-2100) are shown.

Interactive seal level explorer
Use this app to explore sea level estimates (1900-2100) at 578 tide gauge stations, based on tide gauges, GPS, and satellite altimetry with past and future constraints on mountain glaciers, polar ice sheets, thermal expansion, ocean circulation, land water storage, and glacial history. The underlying model enables projections of local relative sea level rise for any given global temperature trajectory, illustrated with three IPCC AR6 Working Group III pathways (current policies, SSP126, SSP585).
Related publication: Mahé Perrette, Matthias Mengel, Relative sea level projections constrained by historical trends at tide gauge sites. Sci. Adv. 11, eado4506 (2025). DOI:10.1126/sciadv.ado4506.

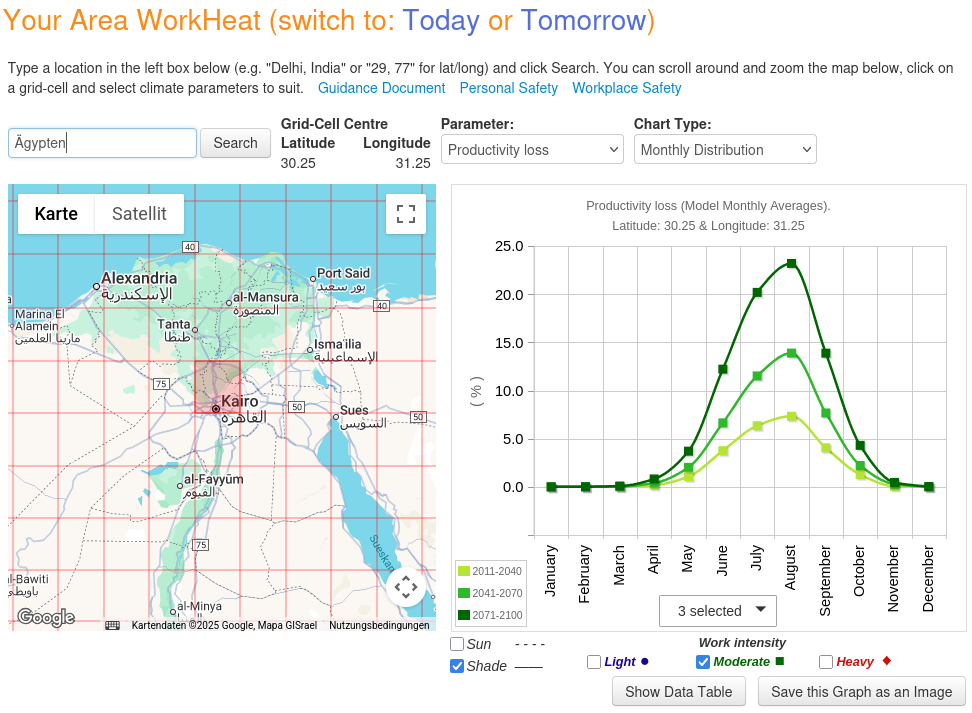
Your area tomorrow (climate and heat-impact data)
ClimateChip provides ISIMIP 3a and 3b primary climate data for 2 models and 2 pathways, as well as several derived humidity and heat stress indexes (WBGT, UTCI and HI).
Furthermore, the tool provides human productivity heat-impact data based on WBGT derived from primary ISIMIP (3a and 3b) data.

